What Have Bloomington, Indiana Home Values Done Over the Last 20 Years?
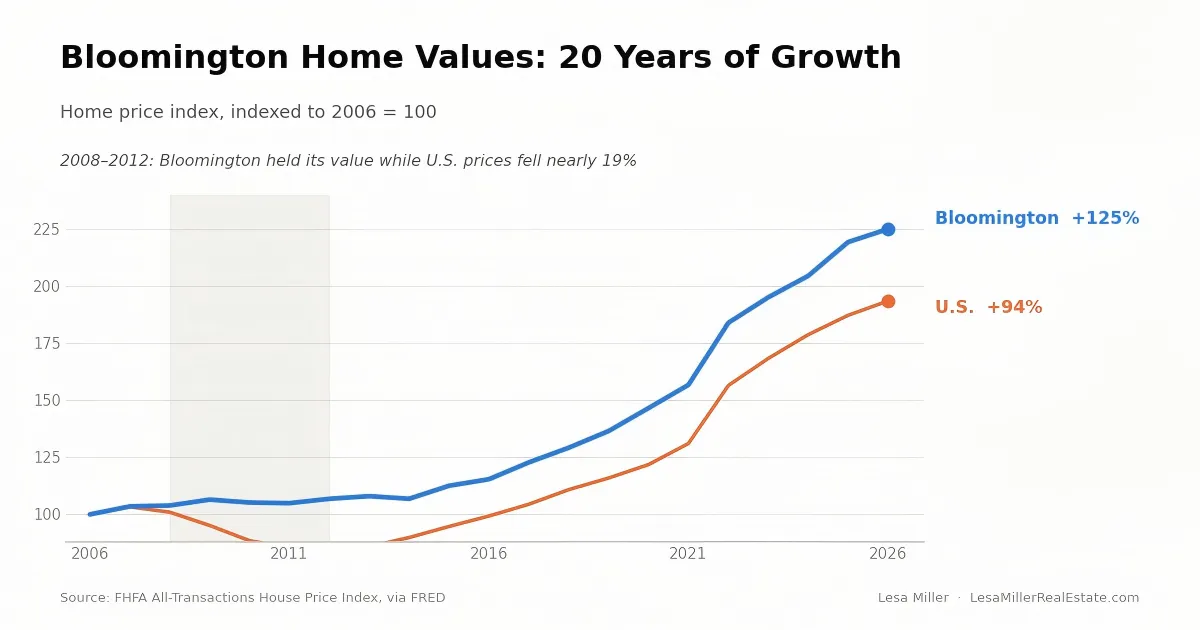
Buyers ask me some version of this question every week. Usually it comes out as "is this a smart place to buy?" and what they want is not a sales pitch but a number. After more than 20 years selling homes in Bloomington and the surrounding south-central Indiana communities, I finally sat down with the federal data and pulled the answer together in one place. The short version: Bloomington-area home values are up about 125 percent over the last 20 years. The longer version is more interesting, because the path there is not what most people assume.
What does the 20-year data show?
The cleanest long-run measure we have is the Federal Housing Finance Agency's All-Transactions House Price Index, which tracks repeat sales and appraisal data for the Bloomington metro area. You can see the full series yourself on the Federal Reserve's FRED database. In the first quarter of 2006 the index stood at 152.52. In the first quarter of 2026 it reached 343.45. That works out to roughly 4.1 percent per year, compounded, over two decades. For comparison, the national version of the same index grew about 94 percent over the same stretch, or roughly 3.4 percent per year. Bloomington did not just keep up with the country. It quietly outran it.
Did Bloomington crash in 2008?
This is the part that surprises people who lived through the housing crisis somewhere else. Nationally, the FHFA index fell almost 19 percent from its 2007 peak to its 2011 bottom. Bloomington's index in early 2012 was higher than it was in early 2008. Values here essentially held their ground and kept edging upward through the worst housing downturn in modern memory. My read, having sold homes through that entire period, is that the employer base did the cushioning. The university, the hospital, Cook Medical, and Crane kept people employed and kept households forming while much of the country was shedding jobs. I wrote more about how that same employment base shapes today's market in my first-half 2026 market update.
Has the growth been steady?
No, and this is worth understanding before you buy. That 4.1 percent average hides two very different decades. From 2006 to 2016, the index rose about 15 percent in total, which is only around 1.4 percent per year. From 2016 to 2026, it rose about 95 percent, or roughly 6.9 percent per year, with the steepest climb packed into the pandemic years of 2020 through 2023. Anyone who tells you Bloomington reliably delivers 6 or 7 percent a year is quoting the good decade. Anyone who calls the market stagnant is quoting the slow one. The honest number is the blend, and even the blend guarantees nothing going forward.
What about right now, in 2026?
The two measures I watch are telling slightly different stories, and that is normal. The FHFA index for the Bloomington metro was still up about 2.6 percent year over year as of the first quarter of 2026. Meanwhile, based on the most recent Indiana Regional MLS data, the median sale price for Monroe County single-family homes in the first half of 2026 was $352,100, with homes taking a median of 31 days to sell and sellers netting 97.1 percent of list price. Medians move with the mix of what happens to sell in a given stretch, so a softer median does not automatically mean every home lost value. Put together, the picture matches what I see at the negotiating table and wrote about in softer prices and tougher negotiations: a market that is recalibrating after an unusually steep run, not one that is falling apart.
What should buyers and sellers do with this?
If you are buying, the last 20 years argue for patience over timing. The people who did well here were not the ones who guessed the perfect quarter. They were the ones who bought homes they could comfortably afford and held them through a slow decade and a fast one. If your time horizon is short, think harder. Parents buying near campus for an Indiana University student, where a four-year hold is common, should read my piece on the condo-or-house question for IU parent buyers, because four years is short enough that entry price and resale appeal matter more than long-run appreciation. If you are selling, price to the 2026 market rather than to a 2022 memory. And a boundary I take seriously: how real estate should fit into your overall financial picture is a conversation for your accountant or financial advisor. What I can give you is the market itself, in detail, from 20 years of showing up in it.
Want the numbers for your street?
Countywide indexes are useful, but no one buys the county average. If you want to know what homes like yours, or like the one you are watching, have done over time, call me at (812) 360-3863 or visit LesaMillerRealEstate.com.
Lesa Miller, Broker | REALTOR®
Lesa Miller Real Estate | RE/MAX Acclaimed Properties
(812) 360-3863 | [email protected]
LesaMillerRealEstate.com